Voltage Drop Prediction Model
Built an interpretable ML model predicting voltage drop before final test using upstream process data, achieving 25–30% error reduction with quantified uncertainty.
Overview
This project builds an interpretable pre-OCV2 prediction model for K-Value (voltage drop) using only upstream process data. The data is structured as one row per Cell ID sourced from an upstream SQL pull (~208 parameters), with filtering and redundancy analysis to reduce dimensionality and keep the model actionable.
Problem
K-Value is only known after later test steps (OCV2 process), but engineering teams need an earlier indicator to understand process drivers and flag risk. With 200+ upstream parameters (many redundant), the challenge was to build a valid model that:
- avoids leakage by using only data available pre-OCV2
- remains interpretable; which parameters matter, direction…
Model Creation
Defined modeling boundaries and data rules:
- Prediction point: before OCV2
- Allowed inputs: any measurements collected before OCV2
- Target: K-Value (voltage drop)
- Simplifications: removed reworks; only looked back to the start of the Cell ID
Reduced features and redundancy before modeling:
- Hard-filtered to keep upstream / non-administrative parameters
- Ran PCA to estimate effective dimensionality (no sharp elbow; ~20 PCs explain ~60% of variance in X)
- Used PCA loadings and correlation clustering to identify groups of redundant parameters and guide selection/engineering
Modeled with a deployment-like validation scheme:
- Temporal split using OCV2 time (70% train / 15% validation / 15% test; oldest → newest)
- Metrics: RMSE (primary) and MAE (secondary)
Baselines and models evaluated:
- Mean predictor baseline
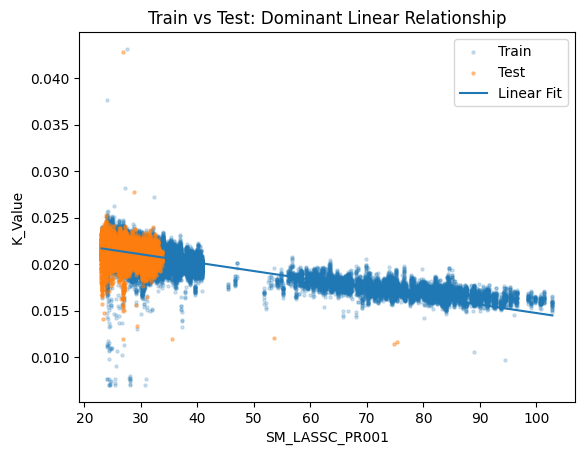
- Single-feature linear regression using the most correlated upstream parameter (SM_LASSC_PR001)
- Multivariate ridge regression (multiple alpha values)
Confidence/uncertainty:
- Computed residual standard deviation from the linear model to form practical prediction intervals.
Model Performance
Demonstrated a stable pre-OCV2 signal vs “do nothing”:
- Mean baseline (test): RMSE ~0.0011, MAE ~0.0008
- Best single-feature linear (test, SM_LASSC_PR001): RMSE ~0.0008, MAE ~0.0006
- ~25–30% error reduction from a single upstream parameter (15-day window)
Verified on a much larger time window / dataset: Data expanded from 151,271 → 341,665 rows Over ~3 months:
- Mean baseline (test): RMSE ~0.0010, MAE ~0.0008
- Best single-feature linear (test): RMSE ~0.0007, MAE ~0.0005
Ridge (multiple α): RMSE ~0.0007, MAE ~0.0005 (no meaningful gain beyond the dominant feature)
Prediction uncertainty (linear model):
- Residual std dev ≈ 0.000820
- Approx intervals:
- ~68% within ±0.00082
- ~95% within ±0.00164
Future Improvement
There are multiple improvements that can be made to the model, including:
- Getting more upstream features
- Get time duration in previous processes
- Check whether the model works differently when this key input (SM_LASSC_PR001) is low versus high
- Ensure the model can take messy data and return same quality
Gallery
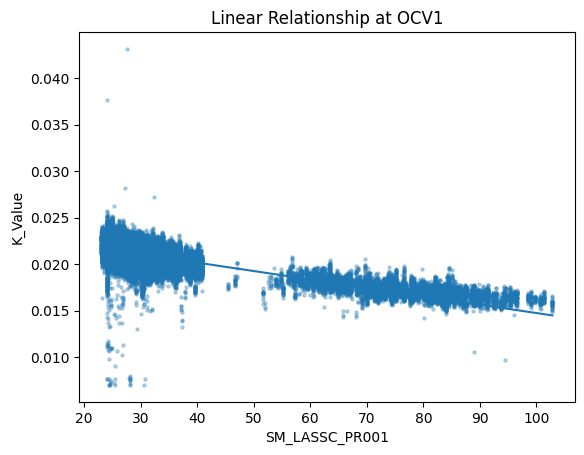 Linear relationship between K_Value (target) and the dominant upstream predictor (SM_LASSC_PR001).
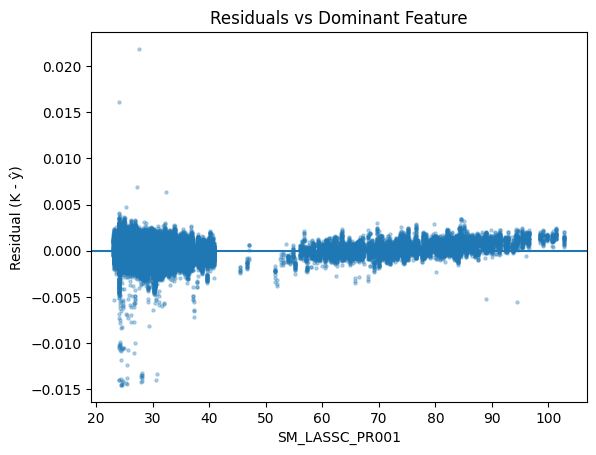 Residual distribution for the linear model (used to estimate prediction uncertainty).
Linear model overlay on test data showing generalization on the most recent period.
Code Repository
Due to proprietary production data, source code is not publicly available.