Process Data Dashboard Creation
Automated Power BI dashboards that centralize production data and enable rapid root-cause analysis, reducing investigation time from days to hours for PE/QE teams.
Problem
Process and quality engineers spent hours manually consolidating data from disparate sources before they could even begin root‑cause investigations. Each analysis required pulling CSV exports, merging datasets across tools routing systems, and manually cross-referencing timestamps—turning what should be rapid troubleshooting into multi-day efforts. This lag prevented timely responses to production issues and limited the team’s ability to identify systemic patterns.
Solution
I designed and deployed a suite of Power BI dashboards that became the department’s central investigation platform. Built on top of the Production Data ETL pipeline, these dashboards leverage clean, standardized datasets to enable rapid analysis. Using Power Query for automated data ingestion and DAX for complex measure calculations, I built repeatable workflows that:
- Centralized multi-source data into a single interface, eliminating manual CSV wrangling
- Automated refresh cycles to ensure engineers always worked with current production data
- Implemented custom visualizations for routing analysis, parameter correlation, and temporal trending
- Created drill-through capabilities enabling seamless navigation from high-level metrics to granular lot details
- Standardized investigation templates so every engineer followed consistent analytical methodologies
The dashboards transformed raw process data into actionable insights, reducing the barrier between question and answer.
Impact
- Accelerated root‑cause analysis from days to hours by eliminating data preparation overhead
- Established department-wide standard for upstream process investigations
- Improved response times to production excursions through real-time visibility
- Enhanced cross-team collaboration with shared, consistent data views
- Enabled pattern recognition across tools and time periods that were previously invisible
Gallery
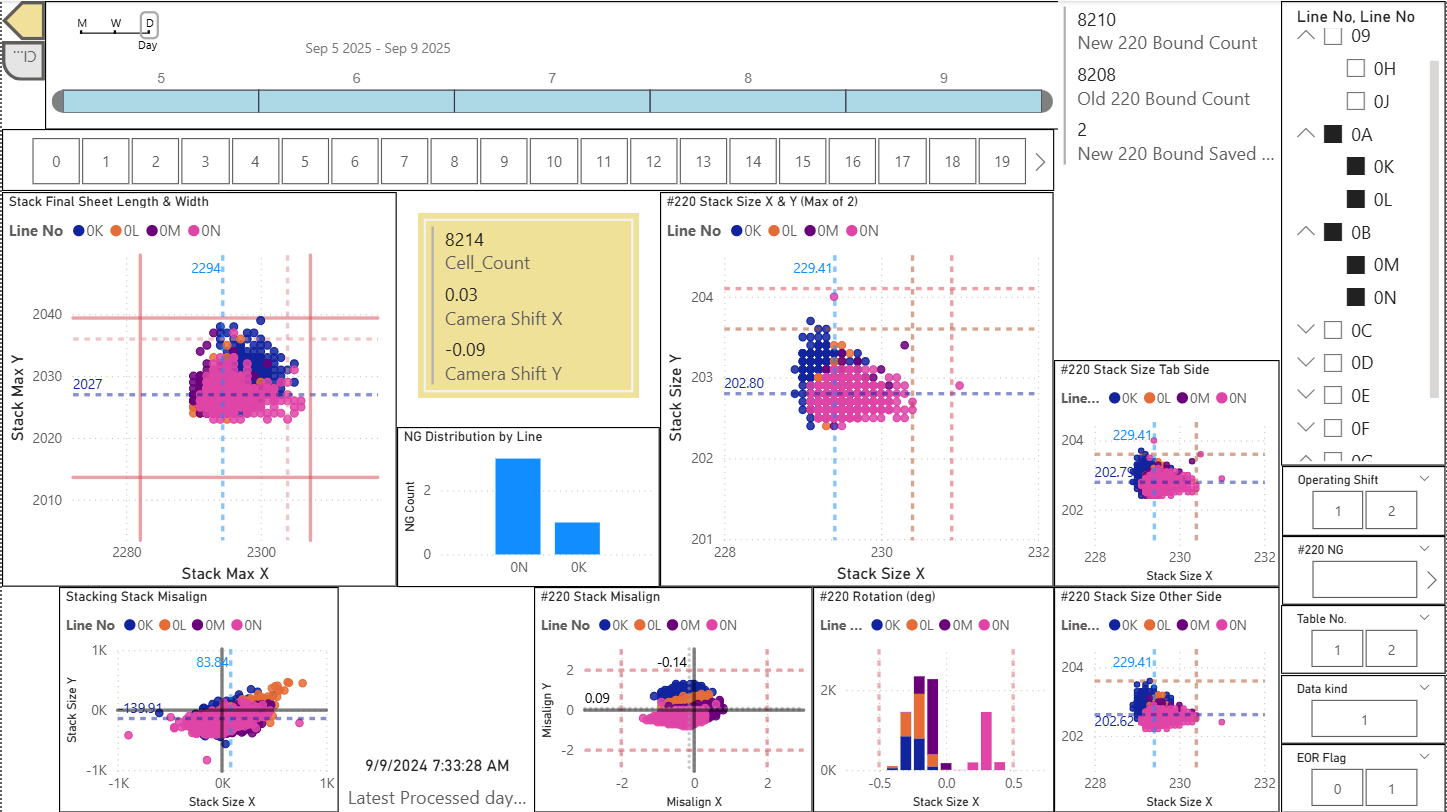
Multi-parameter scatter plot matrix with dynamic filtering and DAX-calculated metrics
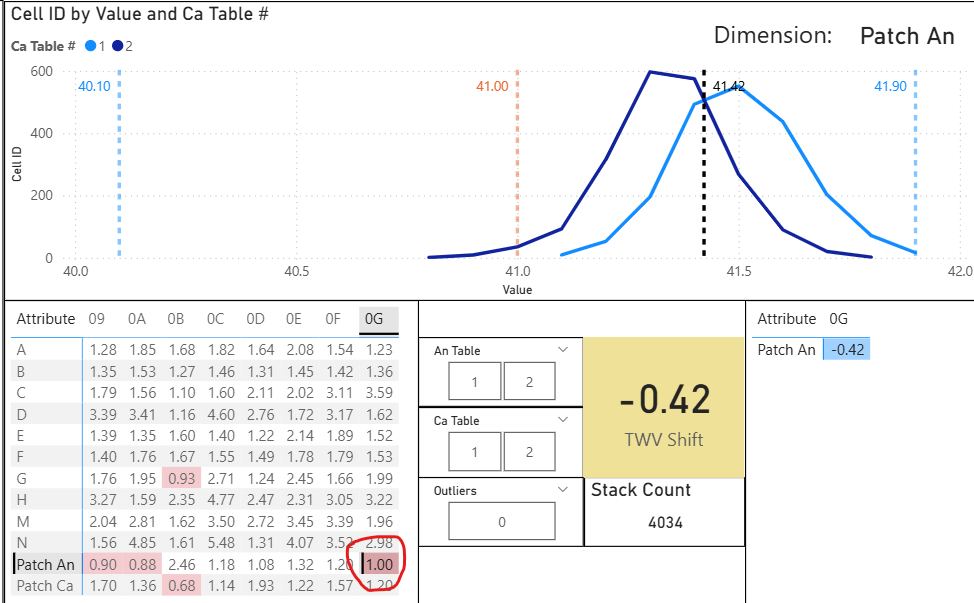
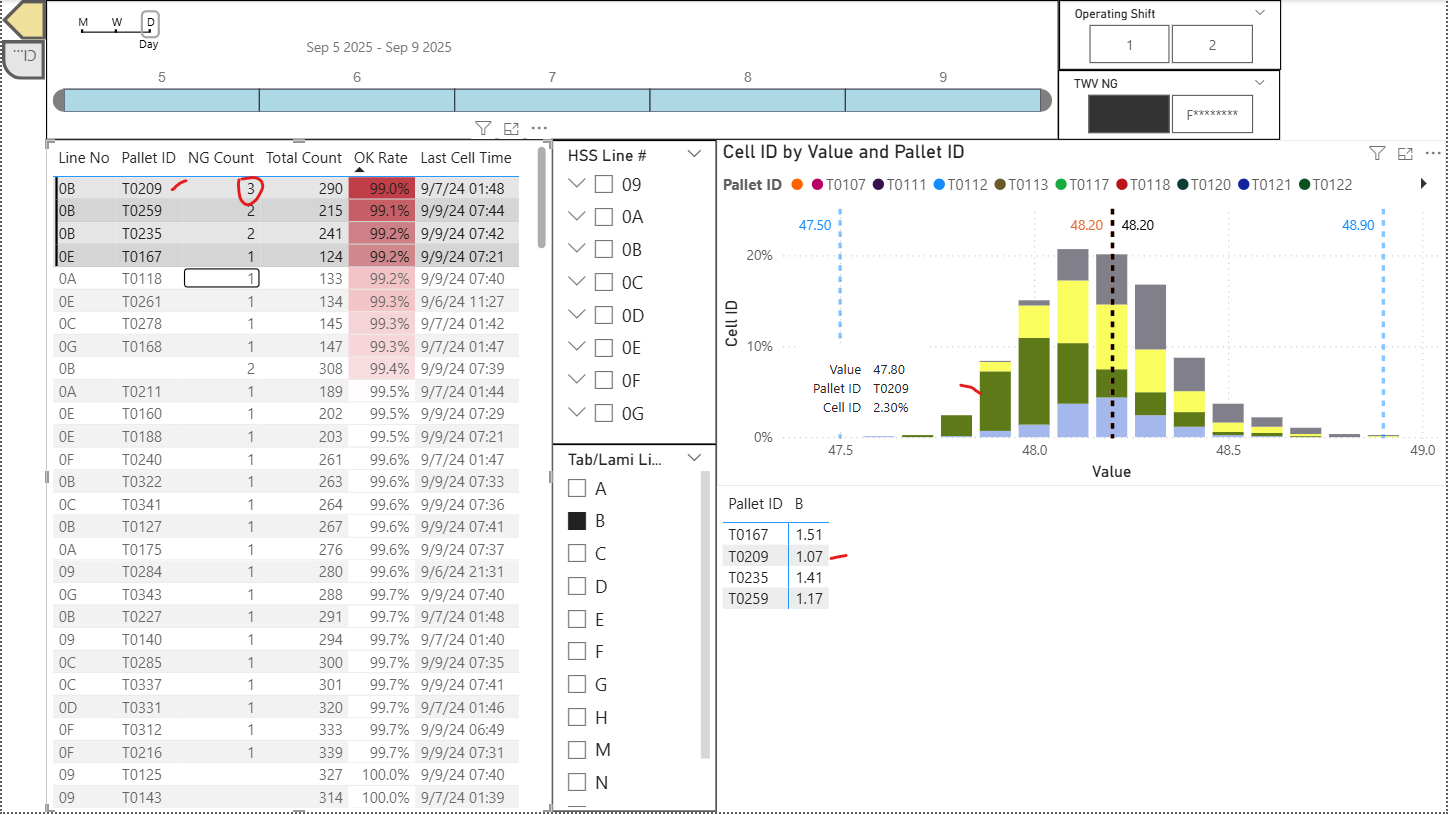 Stacked histogram revealing off-center distribution patterns in underperforming production lot
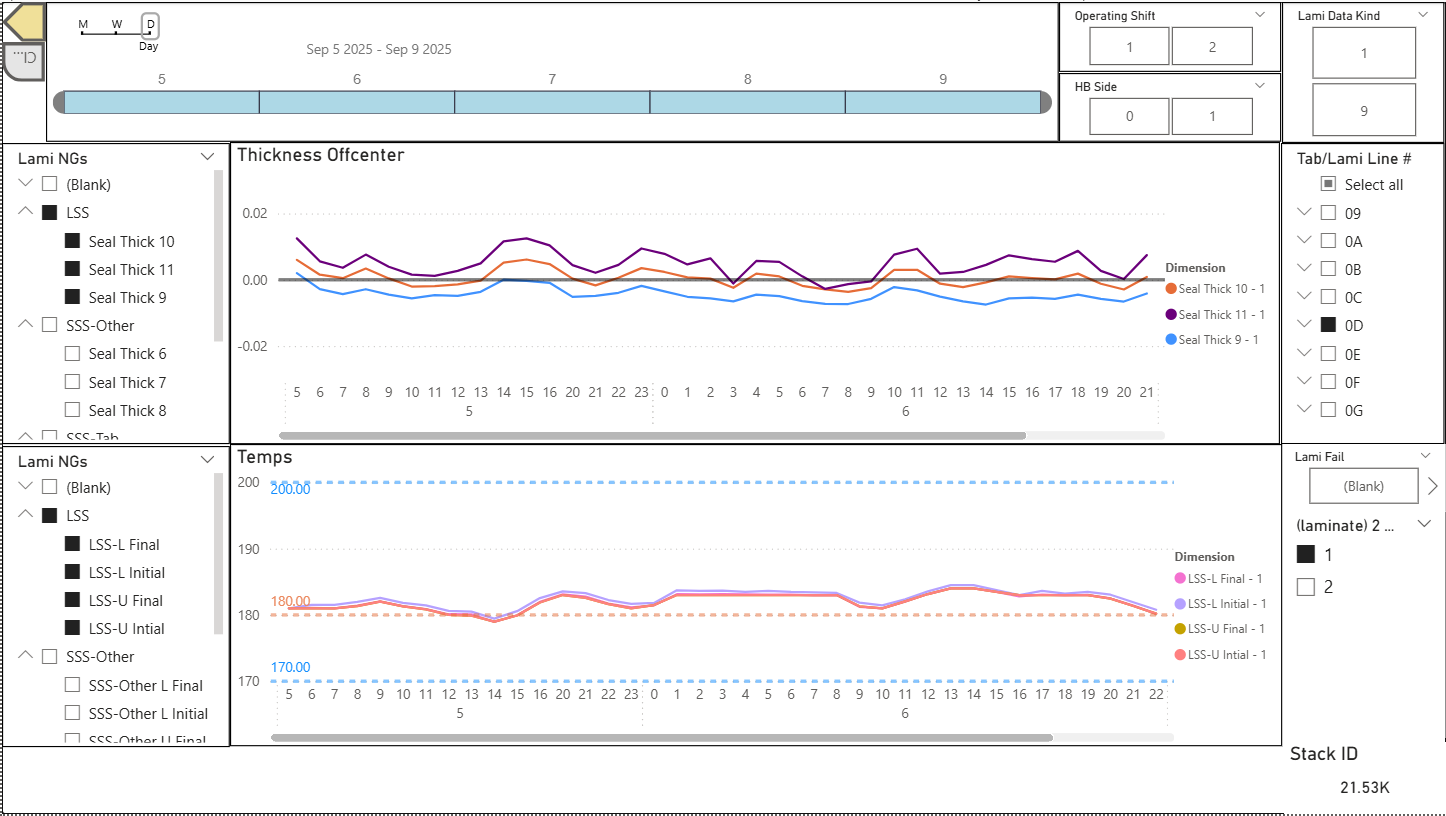 Time-series analysis with dynamic filtering and configurable offset calculations
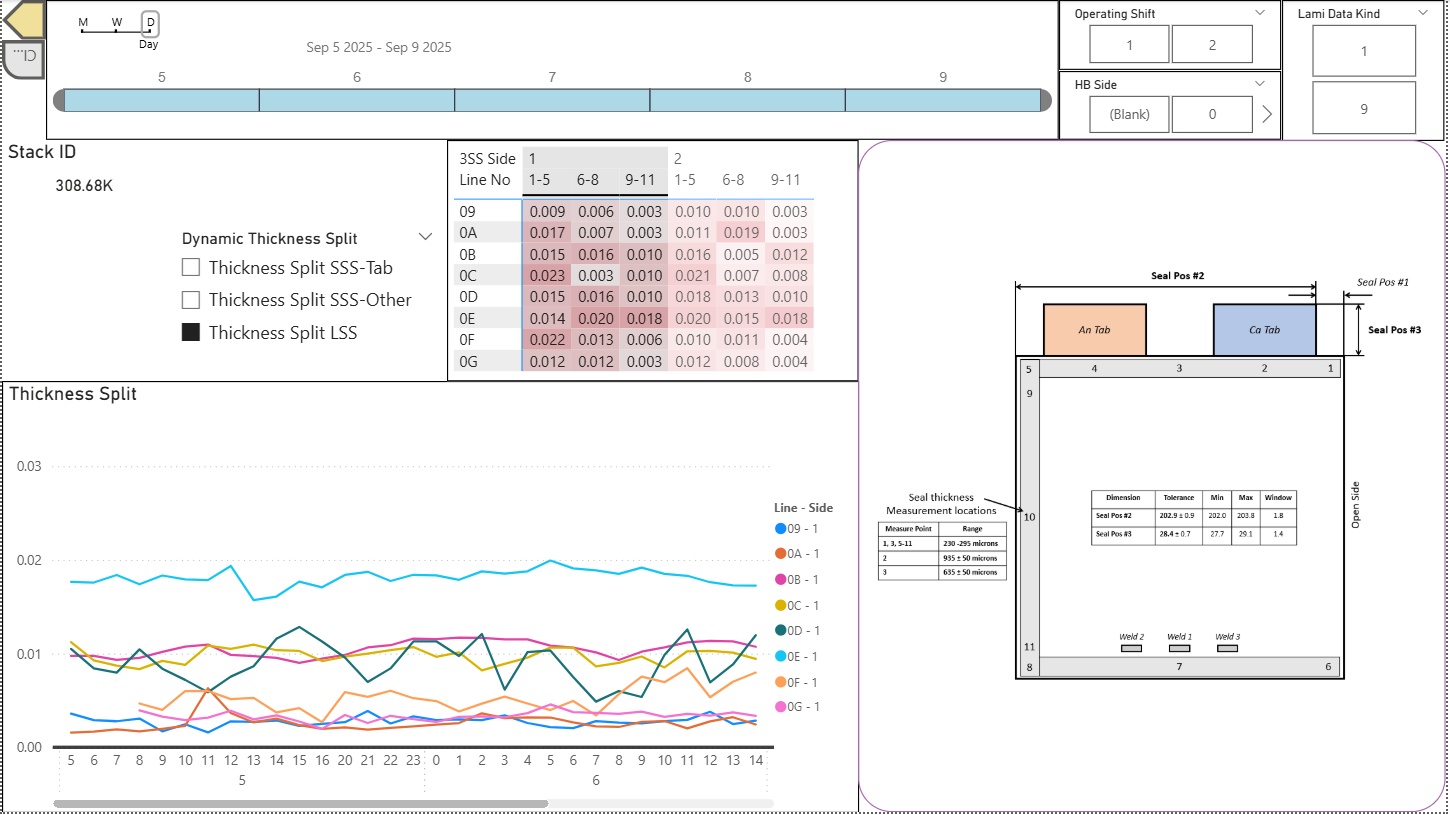 Temporal trend visualization with integrated reference imagery for process context
 Distribution analysis with dynamic filtering and real-time DAX statistical calculations
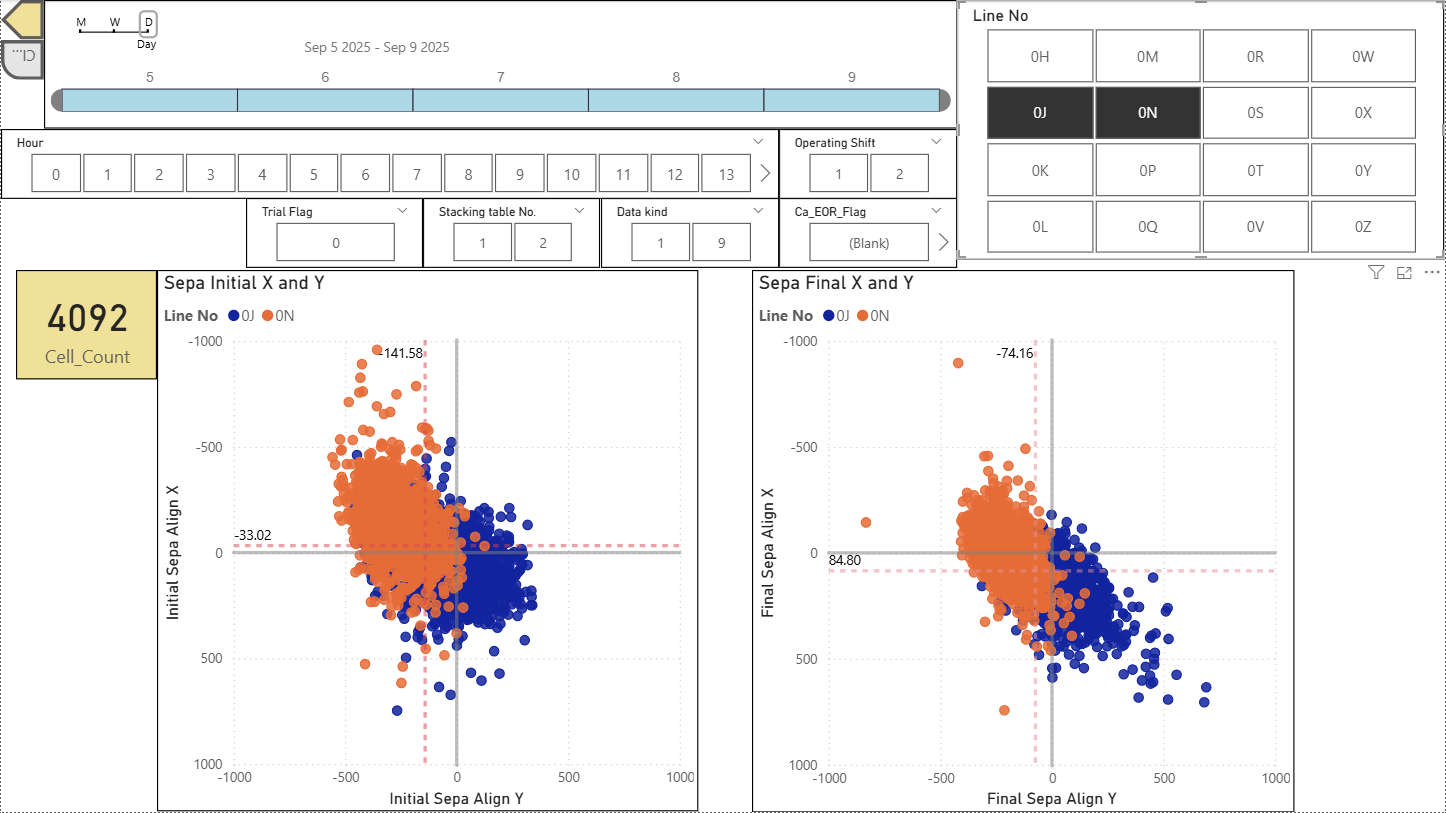 Before-and-after scatter comparison with side-by-side metric analysis
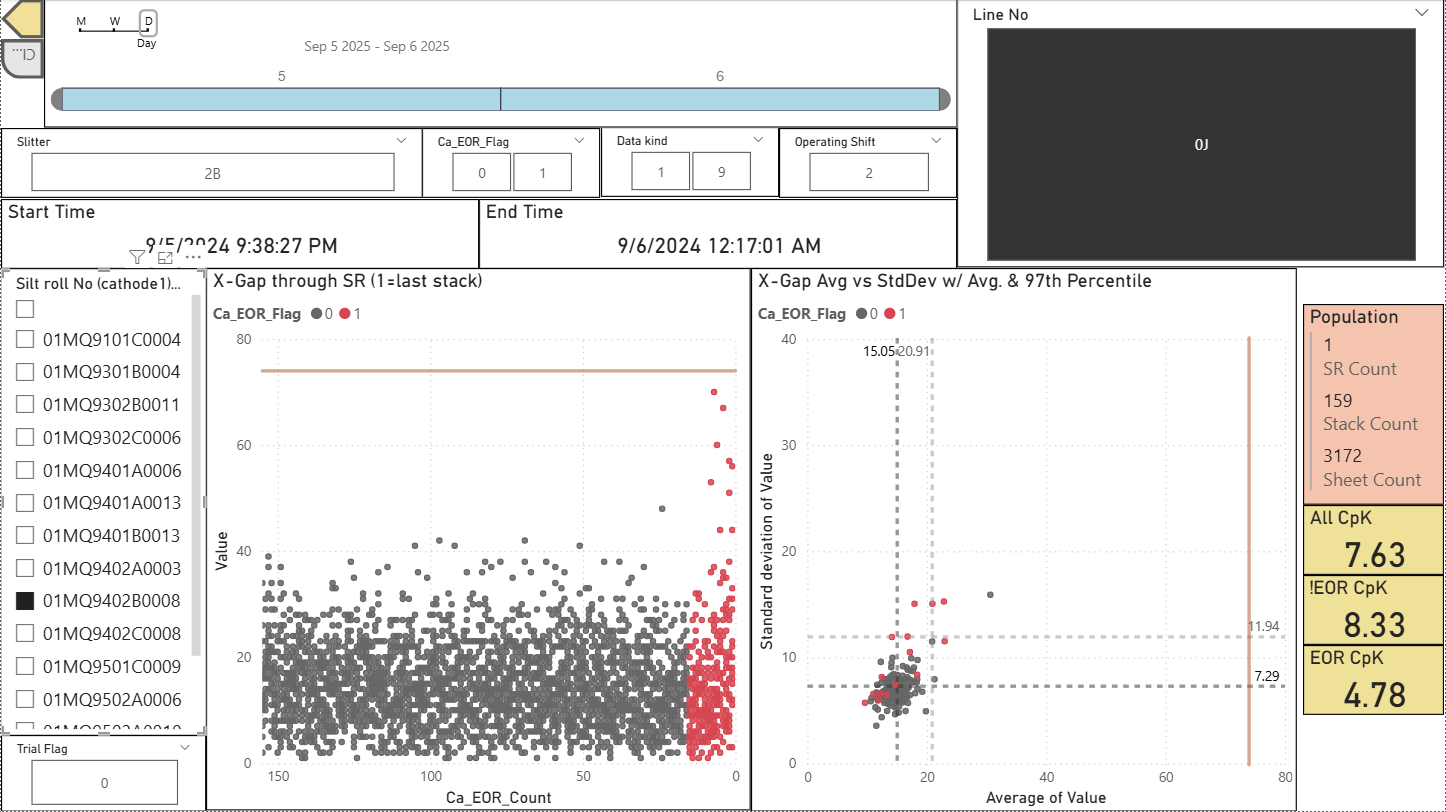 End-of-roll variation analysis with automated boundary detection (red demarcation)
Code Repository
Due to proprietary production data, source code is not publicly available.