Data Decision System (DDS) Dashboards
Created dashboards for a centralized data decision system that delivered SQL-backed dashboards to multiple departments
Overview
The Data Decision System (DDS) was a centralized analytics platform designed to put reliable, up-to-date manufacturing data directly into the hands of decision makers. The system provided a single location where engineering, quality, and operations teams could access consistent dashboards backed by the production datalake, reducing reliance on ad-hoc data requests and manual analysis.
This project focused on building the analytical layer of DDS: defining KPIs, writing SQL queries, and designing dashboards that supported daily and weekly operational decisions.
Problem
Prior to DDS, manufacturing data was fragmented across multiple sources and accessed primarily through ad-hoc SQL queries or manual spreadsheet analysis. This led to several challenges:
- Engineers and managers relied heavily on data specialists to pull metrics
- Different teams used inconsistent definitions for the same KPIs
- Investigations were slow, reactive, and often duplicated across departments
- Decision makers lacked timely visibility into production, quality, and equipment performance
As production issues arose, teams spent more time finding and validating data than analyzing and acting on it.
Solution
I designed and built a suite of SQL-backed dashboards within the DDS framework that served as a trusted, self-service analytics layer for multiple departments.
Key elements of the solution included:
- Writing optimized SQL queries to aggregate and transform raw datalake data into analysis-ready datasets
- Defining and validating KPIs (e.g., throughput, yield, downtime, utilization) in collaboration with stakeholders
- Designing dashboards that aligned metrics with operational workflows and decision cadence
- Ensuring dashboards refreshed consistently and reflected a single source of truth
The resulting system allowed users to move directly from high-level metrics to deeper investigation without needing custom queries or manual data preparation.
Impact
- Enabled engineering, quality, and operations teams to self-serve critical metrics and investigations
- Reduced ad-hoc data requests and investigation turnaround time from days to minutes
- Supported multiple departments with a shared set of trusted dashboards and KPI definitions
- Dashboards remain actively used 9+ months after initial deployment, demonstrating durability and adoption
Gallery
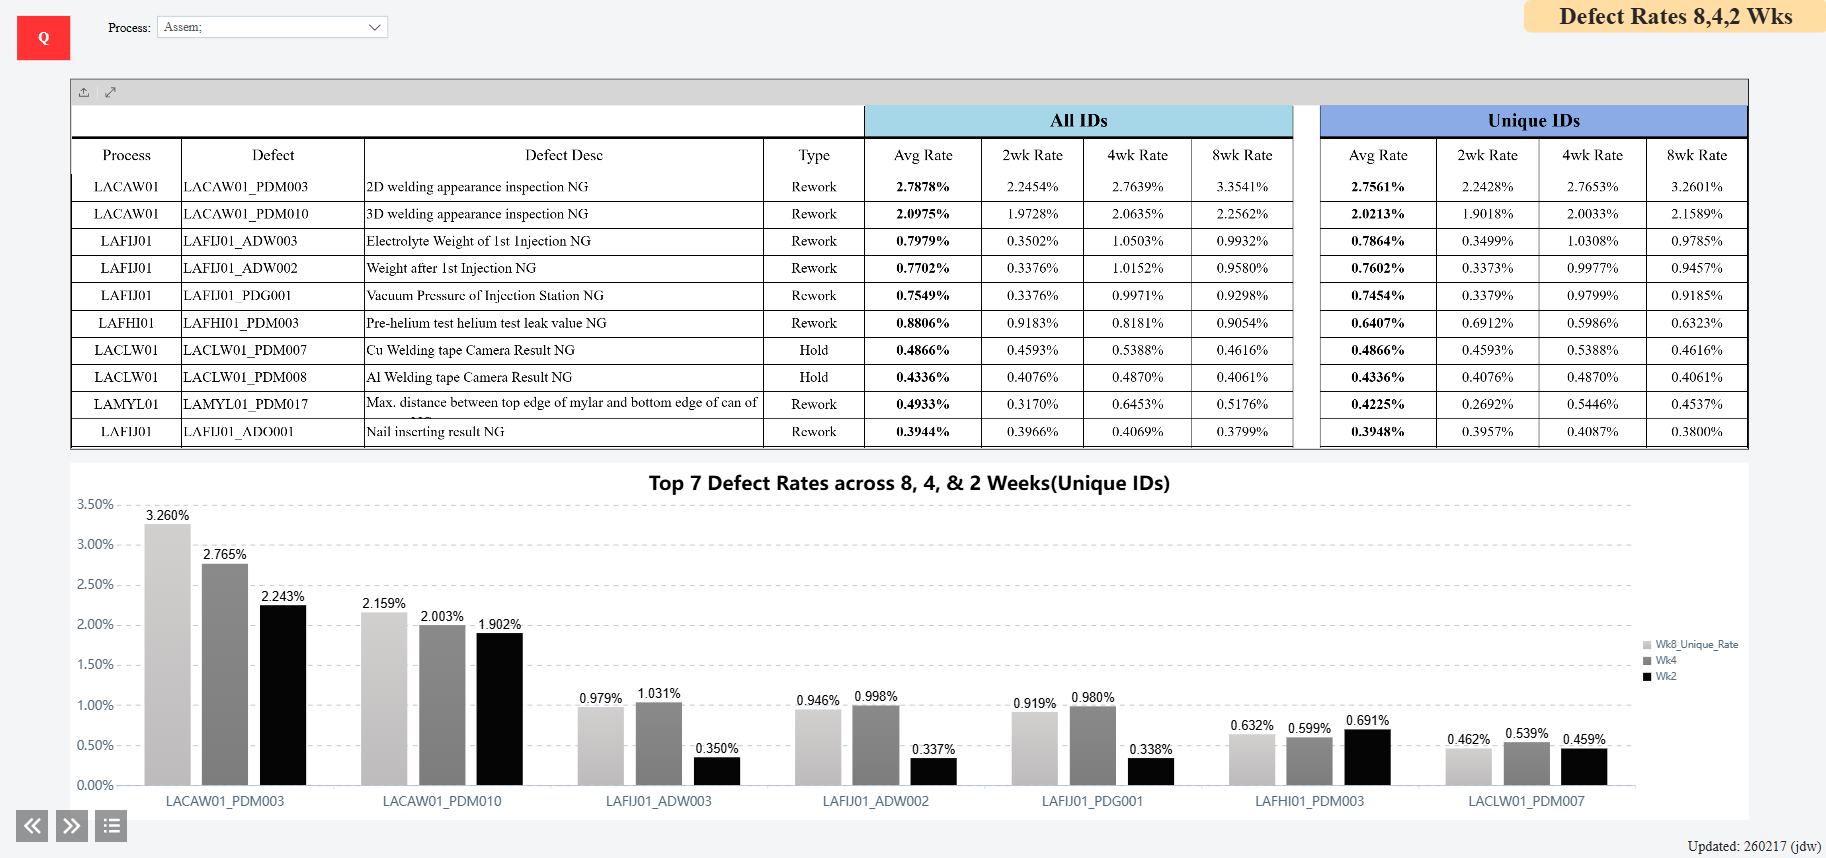
Defect Rate Breakdown: shows 8, 4, & 2 week defect rate (defect count/volume); can see how things are trending
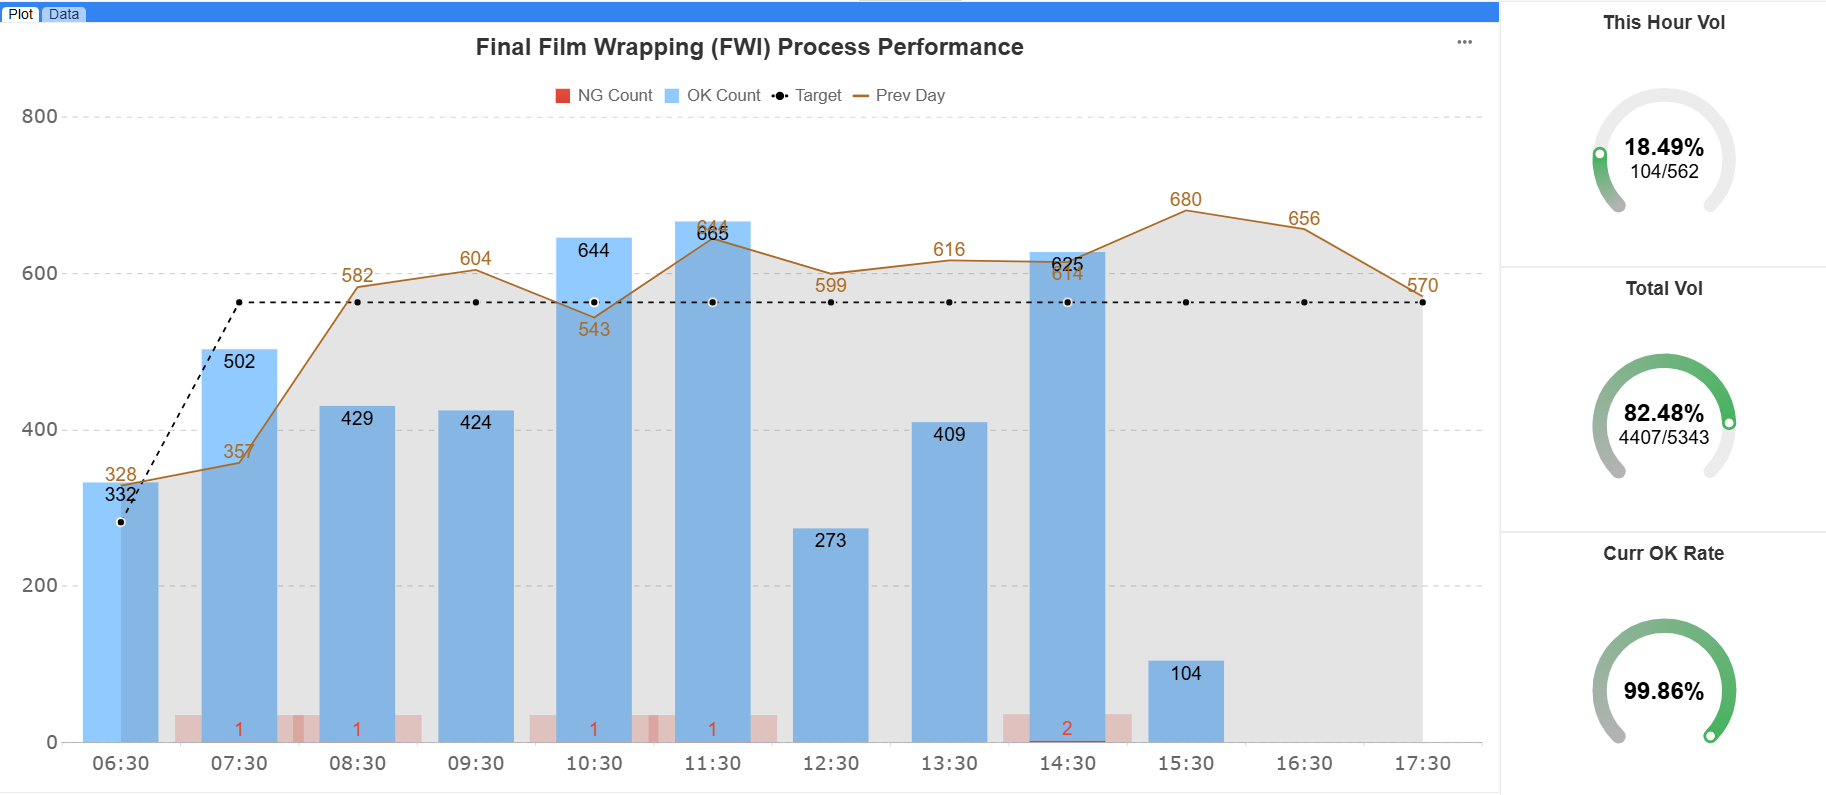 Live production dashboard with target and previous day values by hour
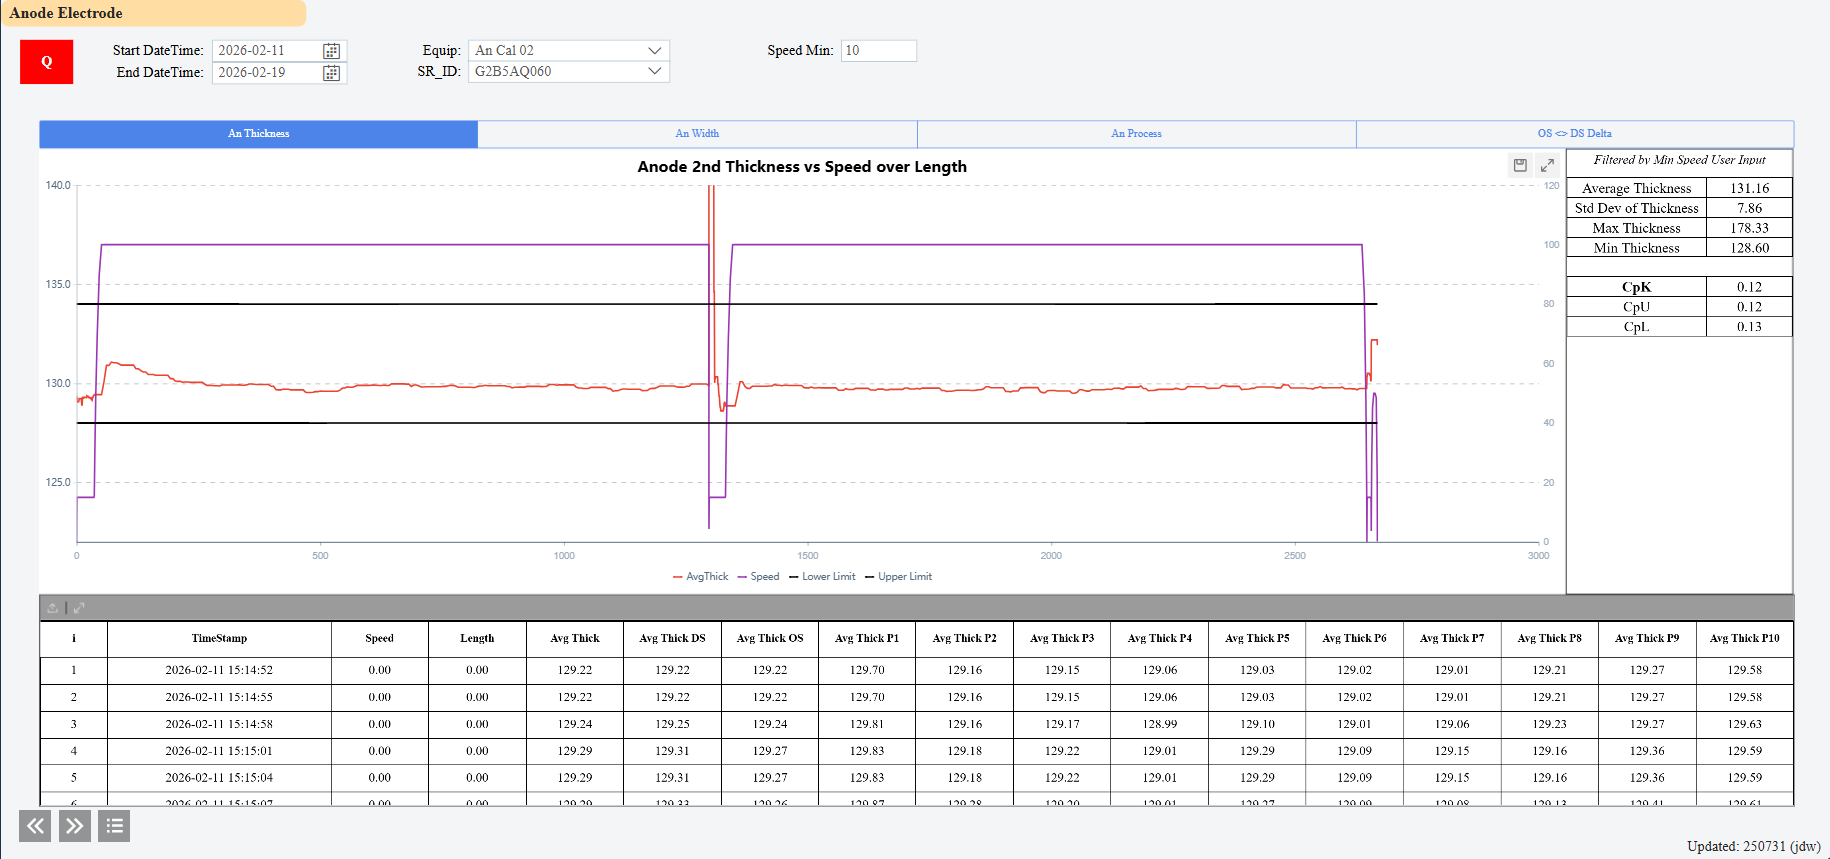 Film Material Thickness throughout Roll
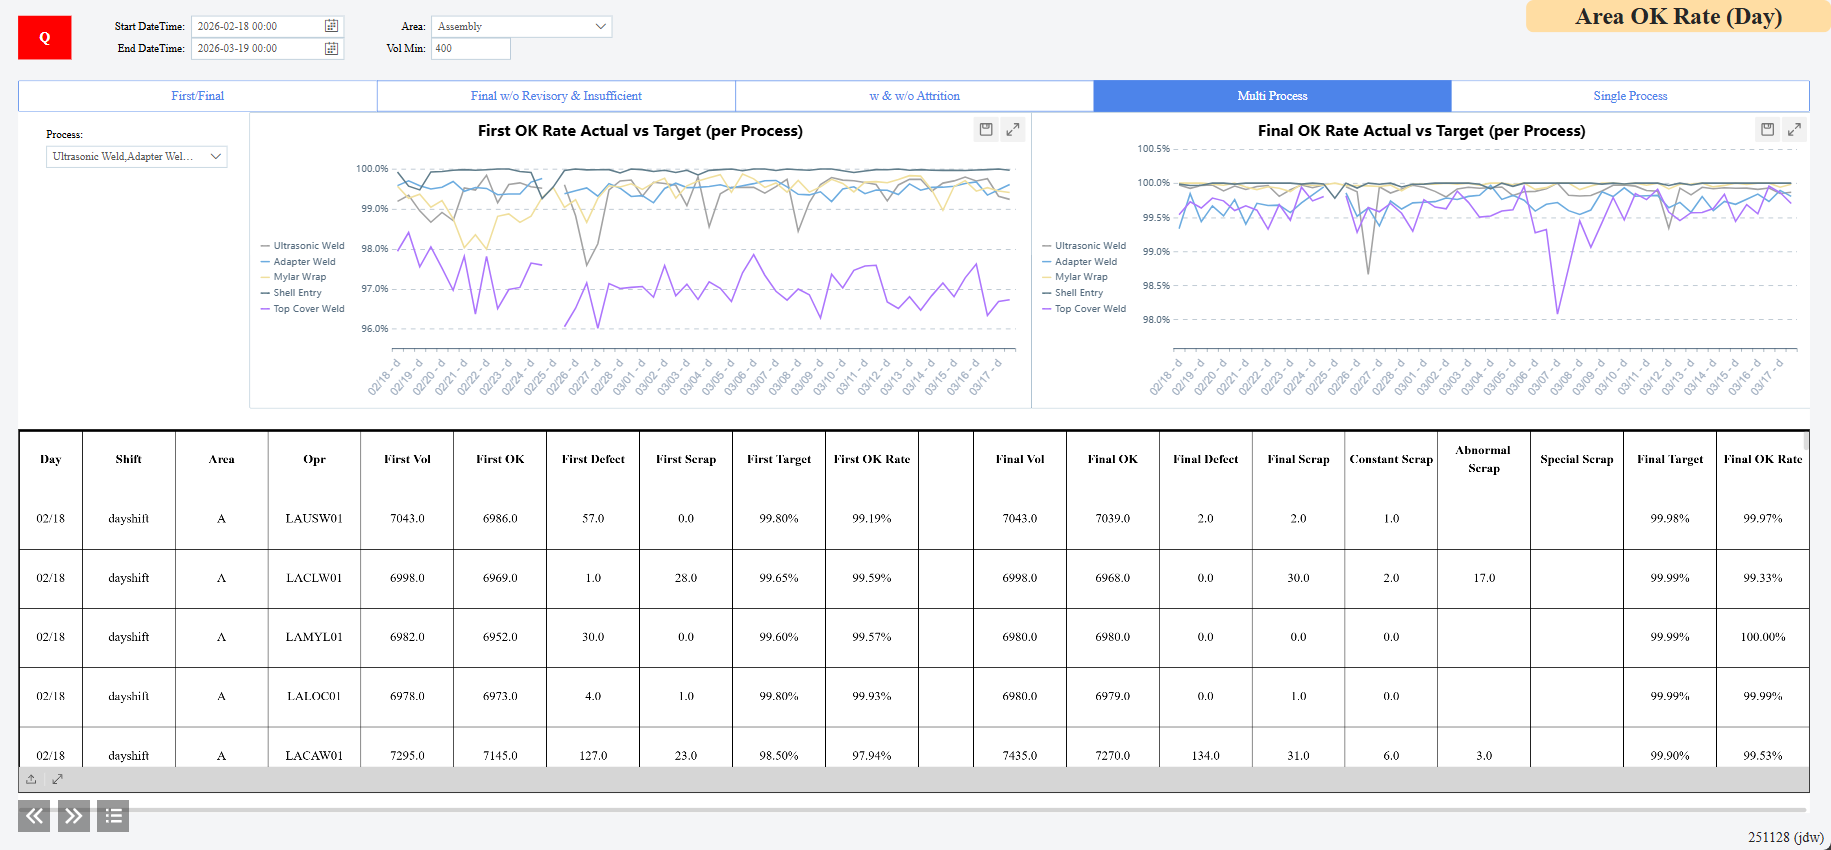 OK Rate KPI over time for multiple processes
Code Repository
Due to proprietary production data, source code is not publicly available.