
Hi, I’m Justin Wasner, an engineer specializing in statistical analysis and data visualization. I enjoy building analysis workflows and dashboards that translate messy data into decisions stakeholders can act on.
I’m currently expanding my skills into machine learning and predictive modeling through self-directed study and hands-on projects. I’m exploring how to apply ML techniques to real manufacturing and operational problems—from feature engineering and model evaluation to uncertainty quantification and deployment considerations.
I’m located in the Nashville metropolitan area and currently exploring opportunities in the data field. If you’re looking for someone to support analytics, reporting, or data-driven product work, feel free to reach out; my email and linkedin is linked above.
Take a look at my featured projects below. You can see all of my projects and more about me using the links above.
Featured Projects
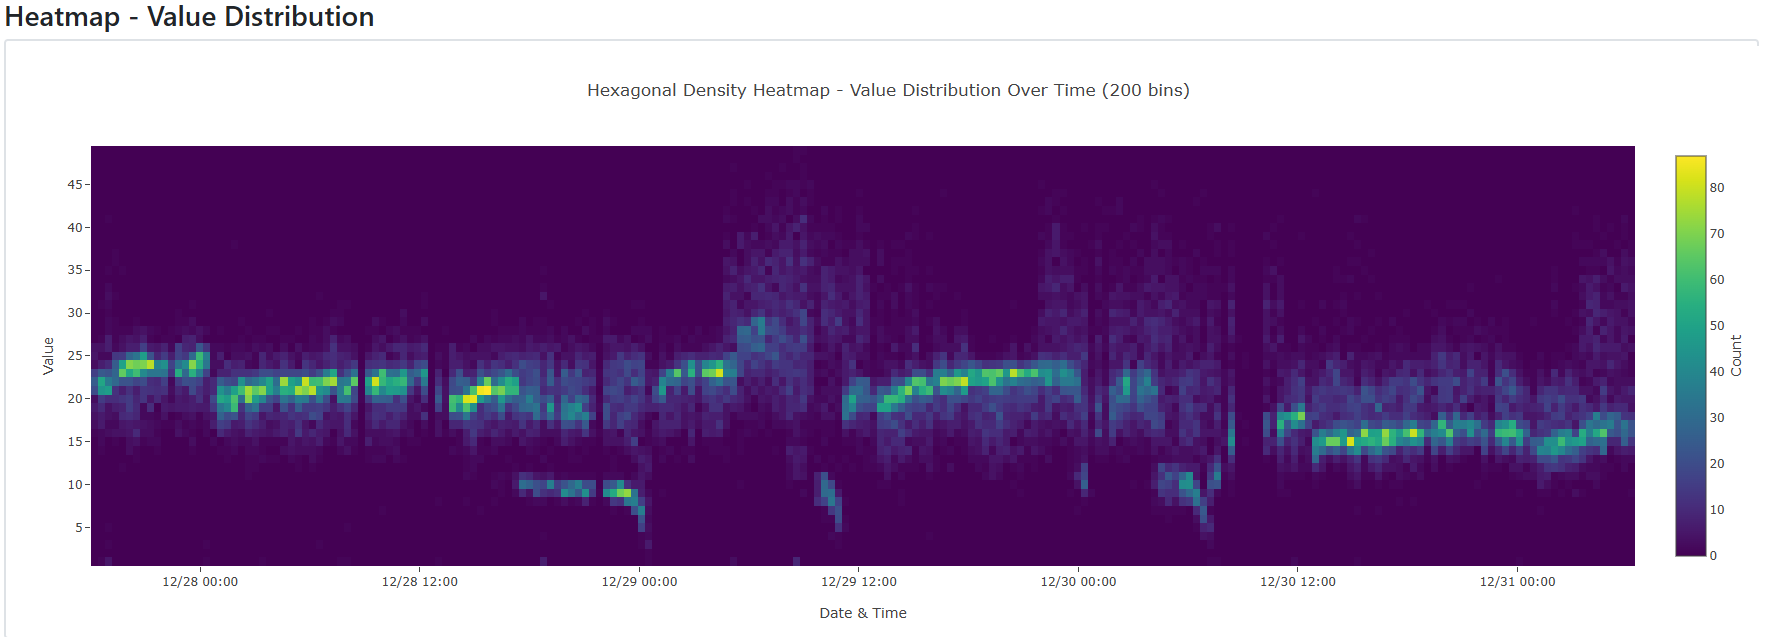
Deep Dive WebApp
December 2025
A data‑driven investigation platform that centralizes raw data, routing, and correlation analysis to accelerate root‑cause discovery for PE/QE teams.
View Project →Voltage Drop Prediction Model
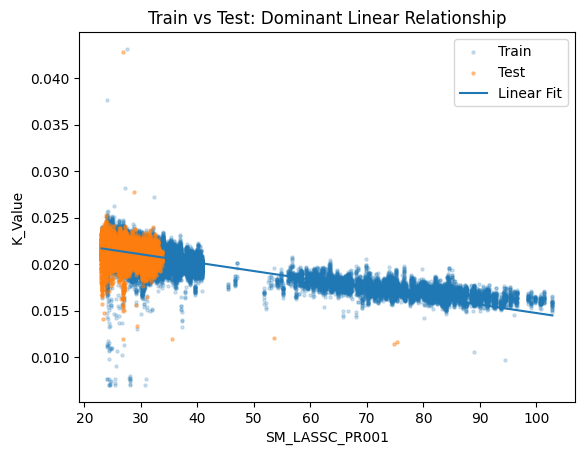
January 2026
Built an interpretable ML model predicting voltage drop before final test using upstream process data, achieving 25–30% error reduction with quantified uncertainty.
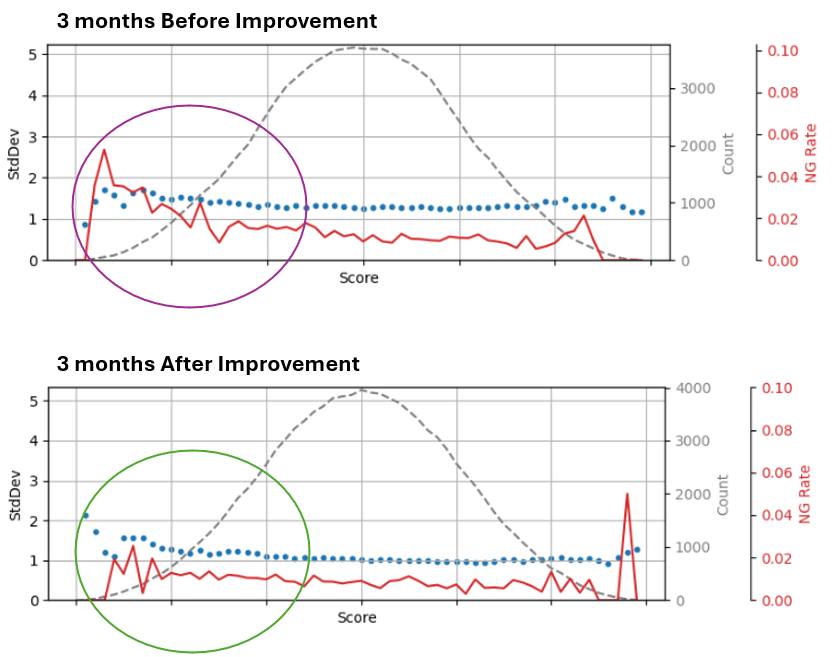
View Project →Material Splice Performance Analysis
November 2024
Performed a comparative analysis of four continuous film materials to identify which material most strongly affected equipment output
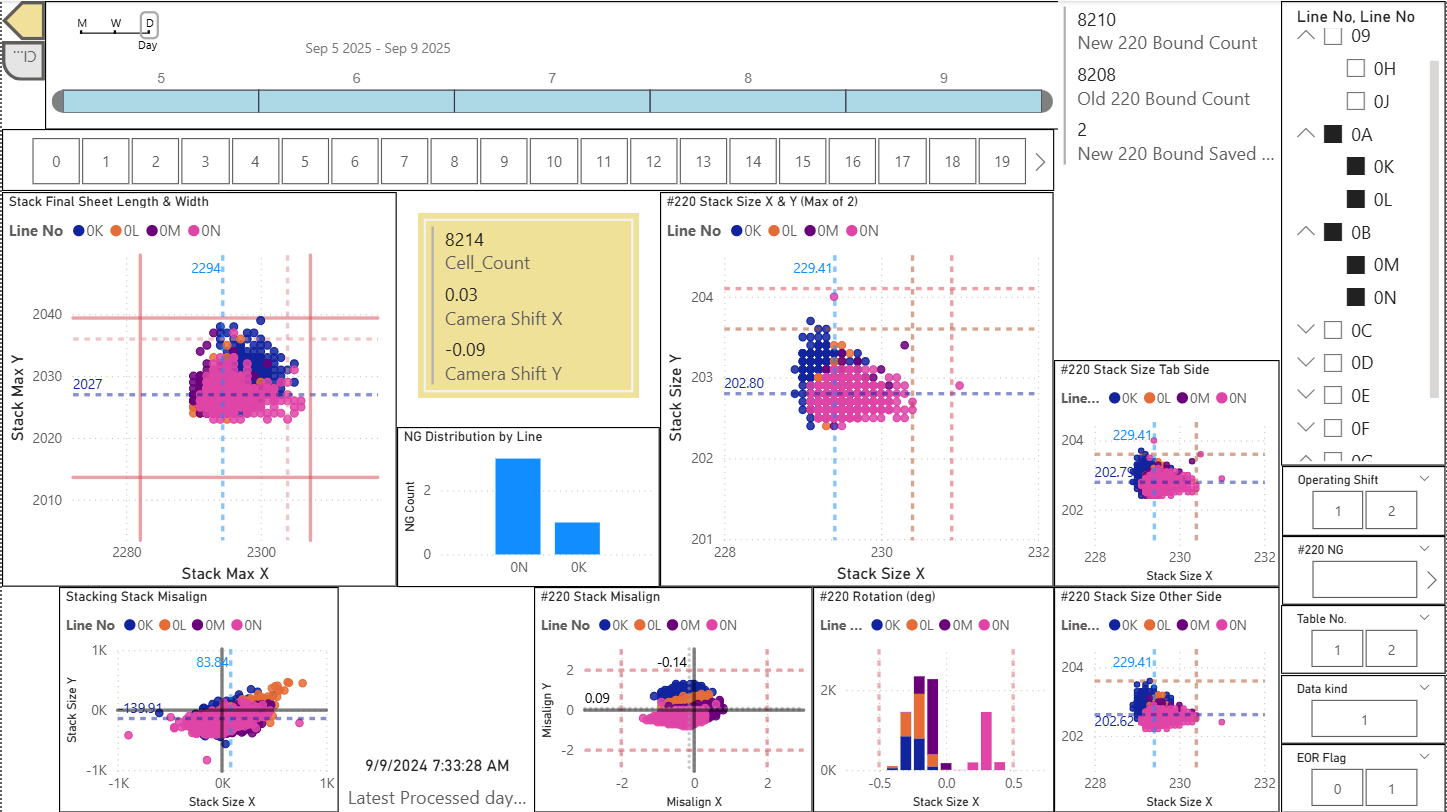
View Project →Process Data Dashboard Creation
January 2023
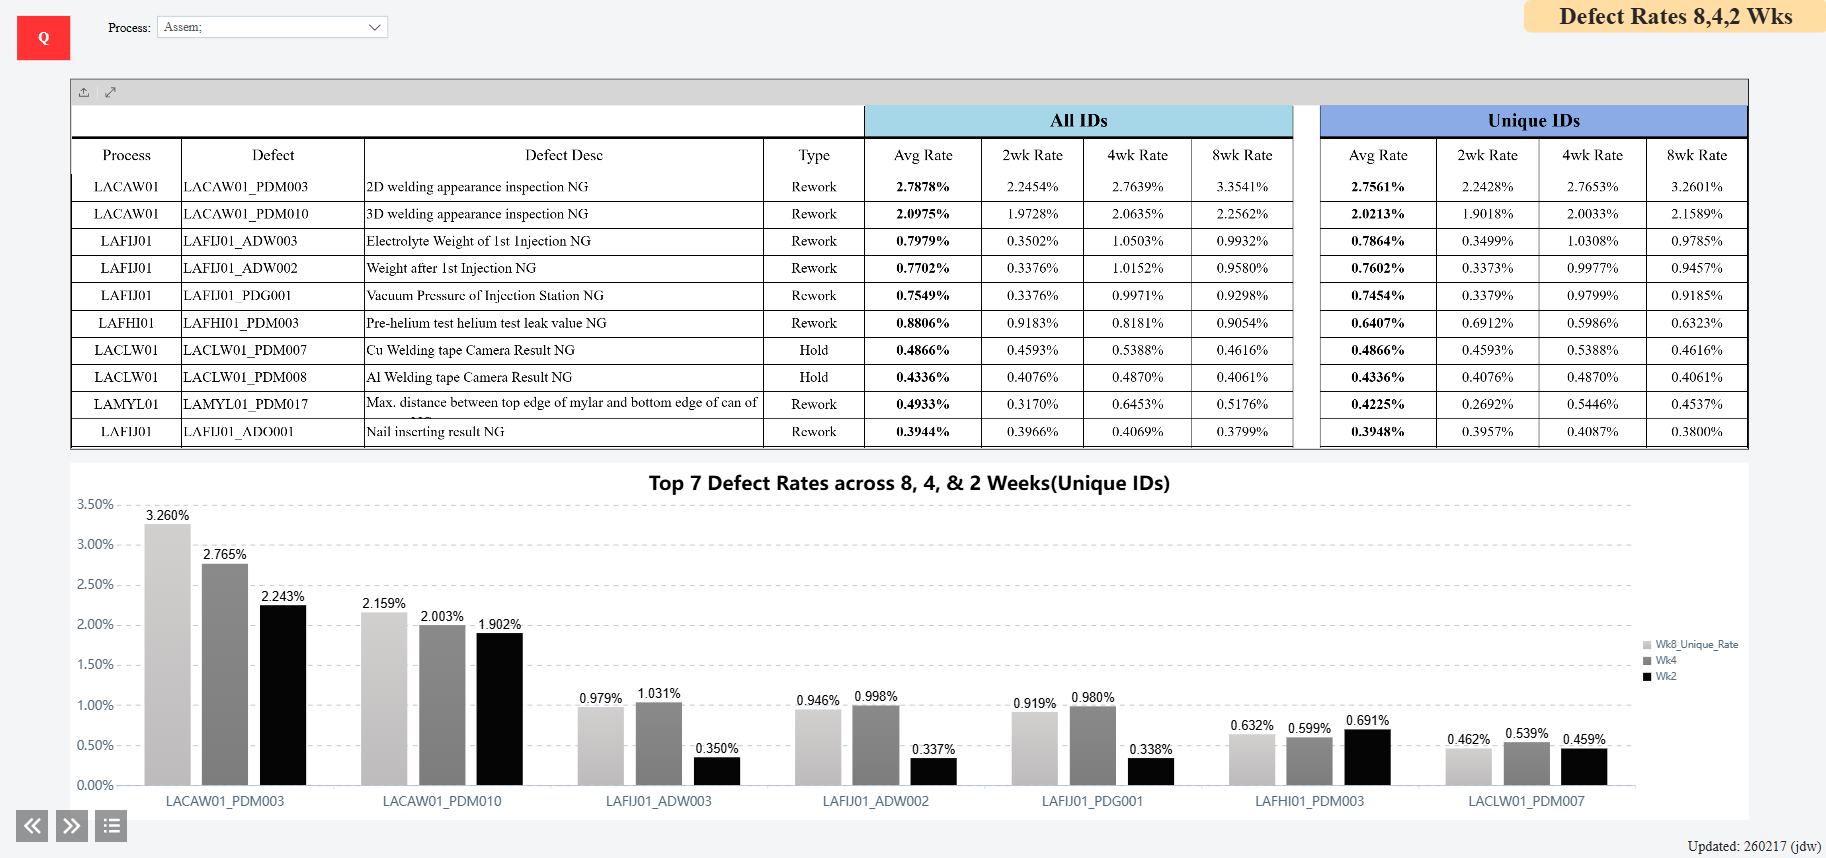
Automated Power BI dashboards that centralize production data and enable rapid root-cause analysis, reducing investigation time from days to hours for PE/QE teams.
View Project →Data Decision System (DDS) Dashboards
March 2025
Created dashboards for a centralized data decision system that delivered SQL-backed dashboards to multiple departments
View Project →Production Data ETL & Reporting Pipeline
January 2023
Built a daily Python ETL pipeline that queried a web API for raw production data, performed complex conditional counting and summarization, and stored the data for downstream visualization in Power BI.
View Project →Weather Weirdness Meter
November 2025
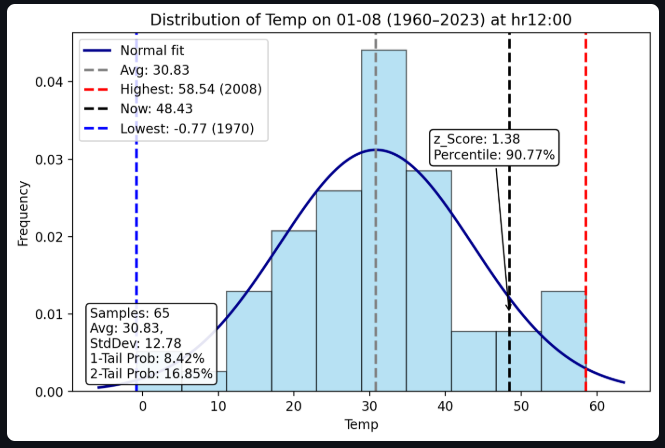
Interactive app that compares current weather to historical hourly data and computes statistical "weirdness" for multiple conditions.
View Project →About Me
I’m an engineer with a strong foundation in root cause analysis, large data, and data visualization. My work focuses on culminating large data sets, conducting exploratory data analysis (EDA), and creating data-driven dashboards to help solve problems.
Core Skills:
- Tools & Languages: Excel (PivotTables, lookups, advanced formulas), Python (pandas, NumPy, scikit-learn, matplotlib), SQL (joins, CTEs, window functions), Power BI (Power Query, DAX), Git/GitHub
- Analytics: EDA, statistical analysis (hypothesis testing), KPI definition, time-series analysis, correlation analysis, anomaly detection, data visualization, analytical storytelling
- Data Prep & Quality: data wrangling, data quality checks & validation, reproducible analysis
- Machine Learning: feature engineering, model training & evaluation (scikit-learn)
- Data Engineering: ETL pipelines, data modeling, query optimization, file formats (CSV/Parquet)
- Web Apps: Streamlit, Flask, APIs
- Manufacturing Domain Expertise: KPI development & review, root cause analysis (RCA), continuous improvement (CI), process mapping/flow understanding, PFMEA, Control Plans (CP), APIS-IQ